See the agents, browser profiles and developer sessions connected through your local companion.
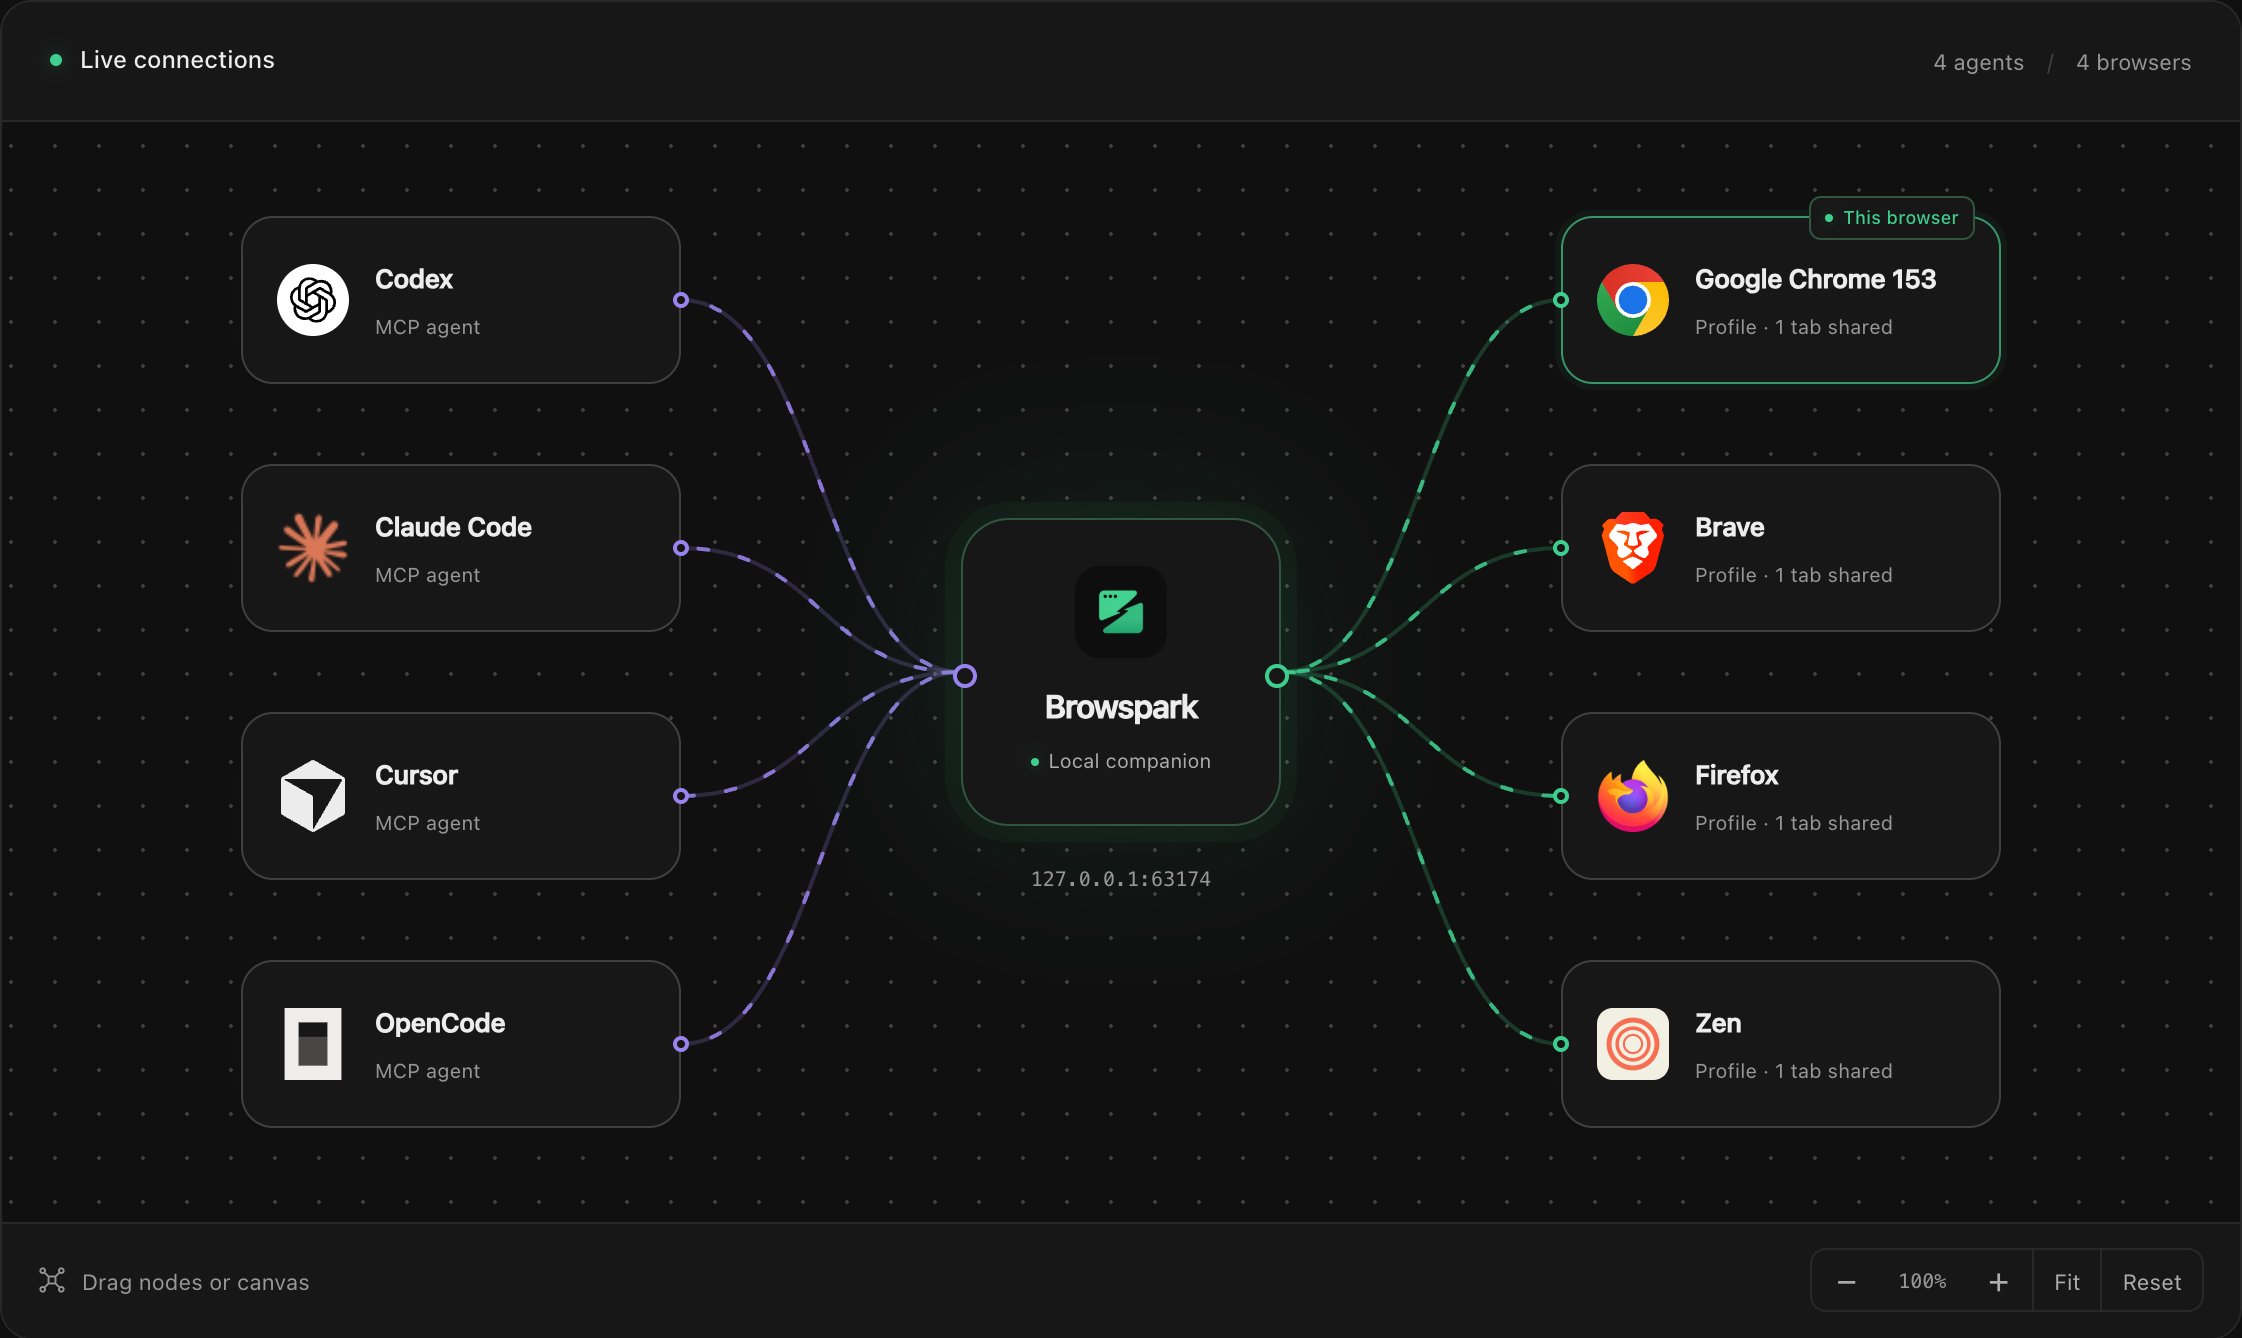
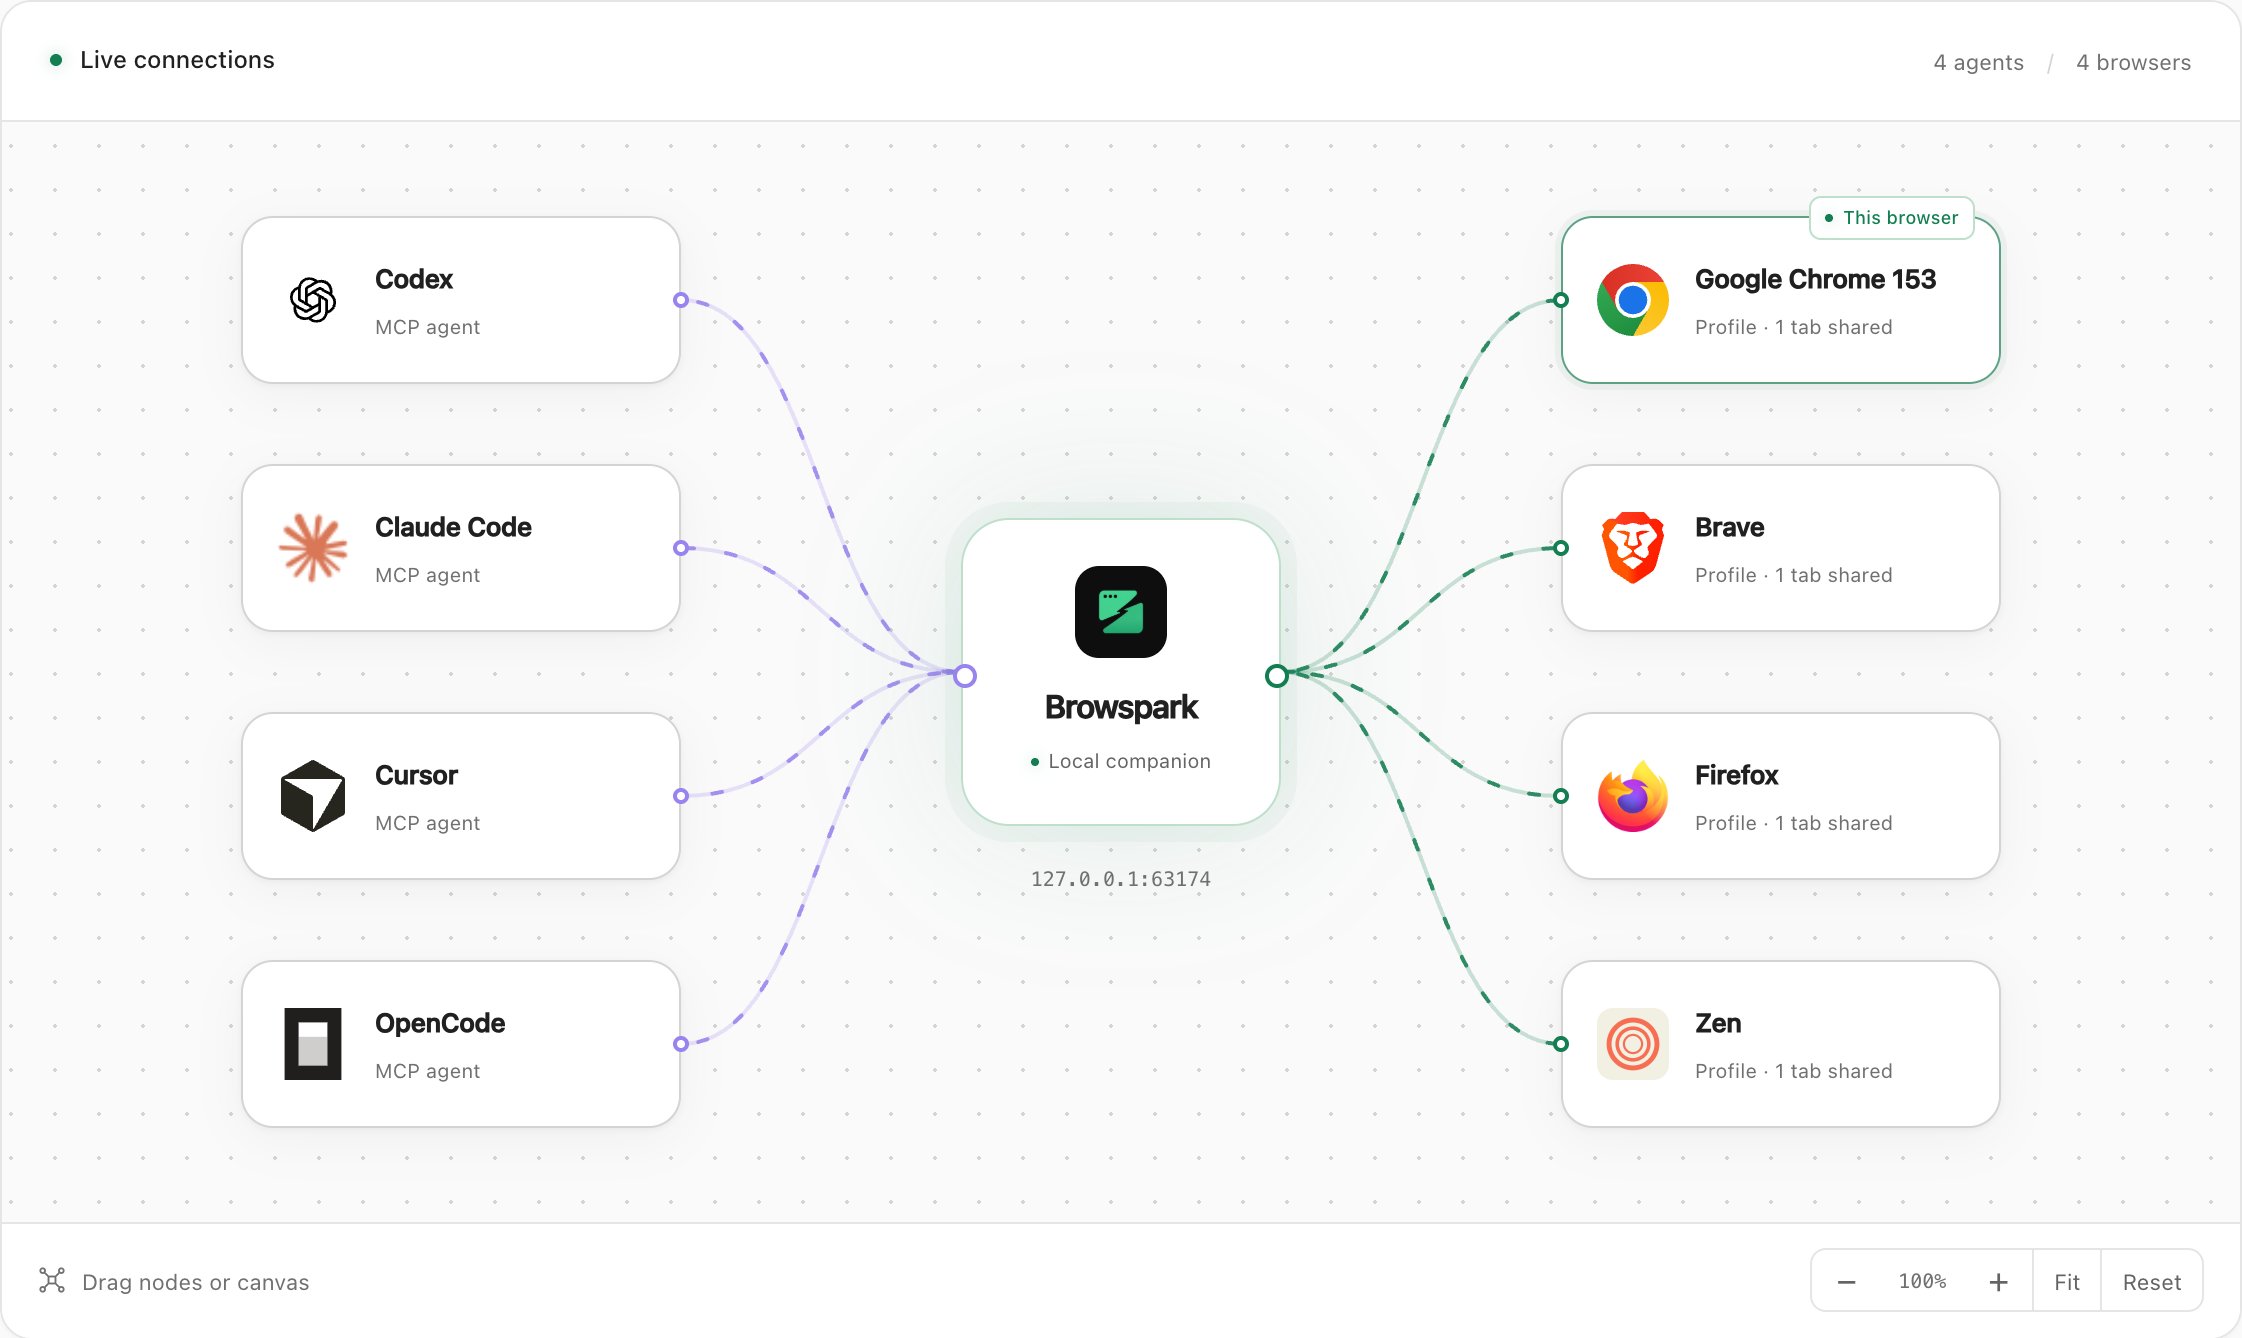
Open Graph in the dashboard sidebar to see connected agents, the local companion, browser profiles and running developer sessions on a dotted canvas. Multiple agents and browsers can appear together.
Dark
Light
Example session with four agents and four browser profiles, captured after Reset → Fit. The screenshots use local test connections, including simulated browser profiles.
Animated lines run from each agent to the companion, then from the companion to each browser. They indicate an established connection, not individual commands or current activity. An agent appears after its MCP client establishes a session with the companion. The lines stay still when your system requests reduced motion.
Drag any agent, browser or companion node, including its logo, to arrange it freely; its connection lines follow as it moves. Drag empty canvas space or scroll to pan. Use Ctrl + scroll (Command + scroll also works on macOS), a trackpad pinch, or the + and − buttons to zoom. Zooming with the pointer keeps that point in place. On a touchscreen, drag with one finger or pinch with two fingers.Choose Fit to bring all nodes into view without changing their arrangement, or Reset to restore the starting layout. Your arrangement stays in place as live data updates and when you visit another dashboard page in the same dashboard tab. Positions are held for that tab’s session; reloading it restores the starting layout. Narrow and wide views keep separate arrangements.
Nodes use locally packaged logos for recognized names: Claude, Codex, Cursor, OpenCode, Kilo and Antigravity; Chrome, Brave, Helium, Vivaldi, Arc, Dia, Firefox, Tor and Zen. Unrecognized agents appear as Other agent with a robot logo. Unrecognized browsers appear as Unknown Chromium or Unknown Firefox, with the corresponding engine’s logo. Hover over a node to see its original reported name. A logo does not add browser capabilities or change the documented browser support.Browser names and developer context names help distinguish profiles and sessions of the same browser. Hover over a node to see its connection identifier or context. This browser marks the profile whose dashboard you are viewing. Extension nodes show shared-tab counts; developer nodes show their open-tab counts. The graph updates as agents and browsers connect or disconnect. Each extension profile still controls sharing from its own Tabs page.The graph displays connection metadata, not tab URLs, page contents or activity history. To inspect commands, enable the separate Activity log.
Settings → Connection graph is on by default and saved per browser profile. Turning it off hides Graph from that dashboard’s sidebar and stops graph updates for that profile. Turn it back on to restore the view.This setting controls the view. Agents stay connected and tab-sharing permissions remain in effect. Use Stop or unshare tabs when you want to revoke access.
A connected extension can show the companion and browser nodes before any agent connects. No agents connected means no MCP client has established a session yet. Waiting for connection data means the dashboard has not received a graph snapshot.If it keeps waiting, check that Connection graph is on, then run the companion and extension from the same current release or checkout. Refresh the dashboard after a UI rebuild; reload the extension after background-process changes and restart the companion after updating its source. Starting another companion while an older process owns the port only relays to that older process. See connected but empty graph troubleshooting.