> ## Documentation Index
> Fetch the complete documentation index at: https://docs.browspark.krishm.dev/llms.txt
> Use this file to discover all available pages before exploring further.
# Introduction
> Browspark lets AI agents operate and debug websites in your own Chrome, with the user in control of what is shared.
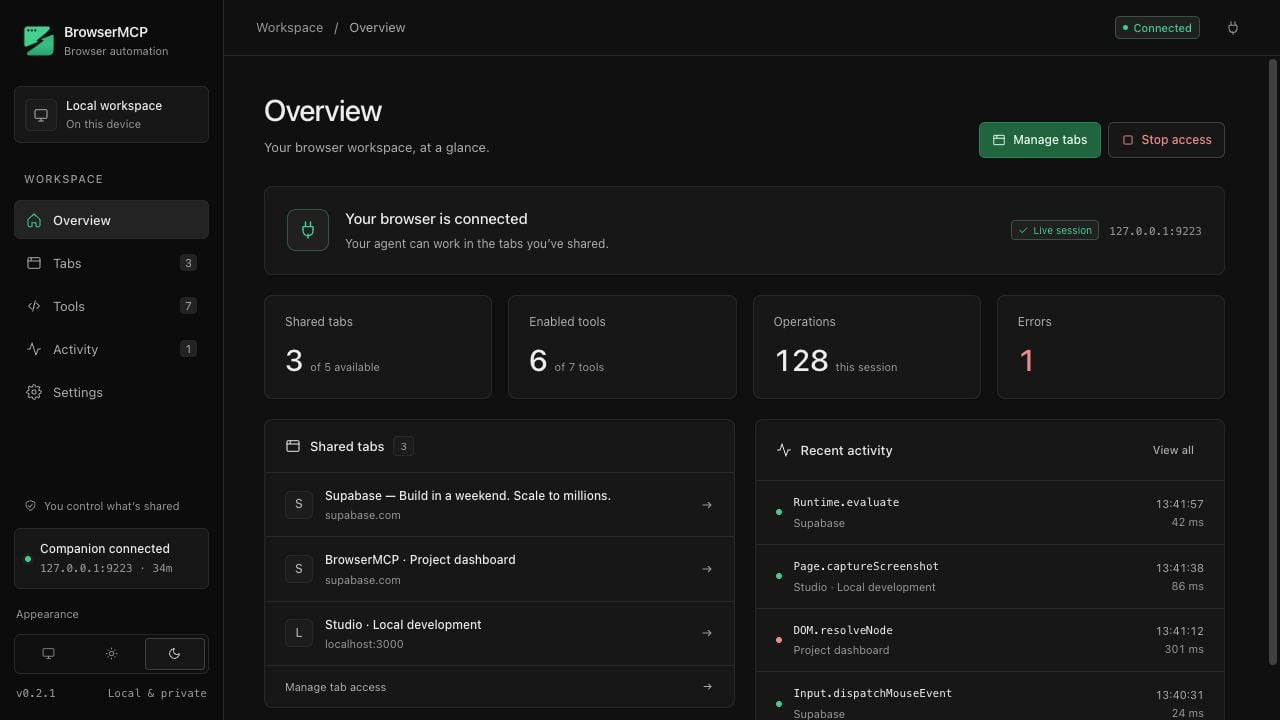
Browspark is a local [Model Context Protocol](https://modelcontextprotocol.io) server plus a Chrome extension. Any MCP client, such as Claude Code, Codex, OpenCode, Cursor, Kilo, Antigravity or Gemini, gets a set of `browser_*` and `devtools_*` tools that work on the tabs you share from the extension's dashboard. Nothing leaves your machine: the companion listens on `127.0.0.1` only.
 ## What an agent can do
Navigate, read an accessible snapshot with stable element refs, click, fill, select, upload, press keys, scroll, wait, handle dialogs and take screenshots, all inside tabs that keep your logins.
Turn a page or a URL into clean markdown, pull tables, links and structured records, print to PDF, and call tools that pages expose through WebMCP.
Console, network with mocks and throttling, sources with source maps, breakpoints and stepping, elements and styles, storage, service workers, emulation, accessibility and security.
Performance traces with Web Vitals, CPU profiles, heap snapshots and leak checks, code coverage, and Lighthouse reports in Chrome's own file formats.
## Two ways to reach a browser
| Mode | What it is | When it is used |
| ------------------ | ------------------------------------------------------------------------------------------------------------------------ | ------------------------------------------------------------------------------------------------ |
| **Extension mode** | Tabs in your own Chrome, driven through the extension's debugger permission. Only tabs you share are reachable. | Everyday work. Keeps your sessions and cookies, stays in your current window. |
| **Developer mode** | A separate Chrome the companion launches with its own persistent profile, talked to over the DevTools Protocol directly. | Only for things Chrome blocks for extensions: heap snapshots, Lighthouse, raw protocol commands. |
The dashboard decides whether the agent may open a developer browser at all. See [Modes](/concepts/modes).
## Where to go next
[Install the companion and load the extension](/get-started/installation). One command and one Chrome dialog.
[Add Browspark to your MCP client](/connect/agents), or use the [HTTP endpoint](/connect/http-and-gemini) for clients that take a URL.
Paste the pairing token into the dashboard, share a tab, and ask the agent to open a website.
## What an agent can do
Navigate, read an accessible snapshot with stable element refs, click, fill, select, upload, press keys, scroll, wait, handle dialogs and take screenshots, all inside tabs that keep your logins.
Turn a page or a URL into clean markdown, pull tables, links and structured records, print to PDF, and call tools that pages expose through WebMCP.
Console, network with mocks and throttling, sources with source maps, breakpoints and stepping, elements and styles, storage, service workers, emulation, accessibility and security.
Performance traces with Web Vitals, CPU profiles, heap snapshots and leak checks, code coverage, and Lighthouse reports in Chrome's own file formats.
## Two ways to reach a browser
| Mode | What it is | When it is used |
| ------------------ | ------------------------------------------------------------------------------------------------------------------------ | ------------------------------------------------------------------------------------------------ |
| **Extension mode** | Tabs in your own Chrome, driven through the extension's debugger permission. Only tabs you share are reachable. | Everyday work. Keeps your sessions and cookies, stays in your current window. |
| **Developer mode** | A separate Chrome the companion launches with its own persistent profile, talked to over the DevTools Protocol directly. | Only for things Chrome blocks for extensions: heap snapshots, Lighthouse, raw protocol commands. |
The dashboard decides whether the agent may open a developer browser at all. See [Modes](/concepts/modes).
## Where to go next
[Install the companion and load the extension](/get-started/installation). One command and one Chrome dialog.
[Add Browspark to your MCP client](/connect/agents), or use the [HTTP endpoint](/connect/http-and-gemini) for clients that take a URL.
Paste the pairing token into the dashboard, share a tab, and ask the agent to open a website.